
IHFC Heat Flow Quality Ranking Scheme
The IHFC heat flow data quality evaluation scheme considers three main criteria:
- Numerical Uncertainty (U-Score) – Measures the statistical uncertainty in heat flow calculations.
- Methodological Reliability (M-Score) – Evaluates the data acquisition method and its adherence to best practices.
- Environmental Perturbations (P-Flags) – Identifies environmental factors that may have affected the measurements.
Each data entry in the database is reviewed based on these criteria and assigned a quality classification, allowing users to assess data reliability at a glance.
The quality scheme explained
U-Score
1. Numerical Uncertainty
The U-score quantifies the numerical uncertainty of a heat flow measurement. It is based on the coefficient of variation (COV), which accounts for errors in temperature gradient and thermal conductivity calculations.
COV (%) | U-Score | Ranking Description |
| <5% | U1 | Excellent |
| 5–15% | U2 | Good |
| 15–25% | U3 | Acceptable |
| >25% | U4 | Poor |
| Not available | Ux | Data missing |
Lower U-Scores (U1, U2) indicate highly accurate measurements.
Higher U-Scores (U3, U4) suggest greater uncertainty and should be used with caution.
M-Score
2. Methodological Reliability
The M-Score assesses the measurement method's reliability based on the type of temperature gradient and thermal conductivity data used. Separate scoring is applied for shallow probe sensing and borehole/mine-based heat flow determinations.
| M-Score | Quality Classification |
| M1 | Excellent |
| M2 | Good |
| M3 | Acceptable |
| M4 | Poor |
| M#x | Metadata missing (x) |
Penalties are applied for insufficient metadata, inaccurate measurement techniques, or missing correction factors. The final M-score represents the overall methodological quality of the data.
P-Flags
3. Environmental Perturbations
The P-Flags identify whether site-specific environmental effects (such as erosion, sedimentation, or topographic variations) have influenced the heat flow data. These effects can significantly alter heat flow measurements and must be considered in data interpretation.
Flag | Perturbation Type |
| S/s | Sedimentation |
| E/e | Erosion |
| T/t | Topography/Bathymetry |
| P/p | Paleoclimate/Glaciation |
| V/v | Surface/Bottom Water Temperature Variations |
| C/c | Convection/Fluid Flow/Hydrate Dynamics |
| R/r | Heat Refraction |
Uppercase letters (S, E, T, etc.) indicate the perturbation was corrected for in the data. Lowercase letters (s, e, t, etc.) indicate the effect is present but not corrected. An ‘X’ flag signifies that the effect was considered insignificant. A ‘-’ symbol means that no information was provided.
The combined Quality Score
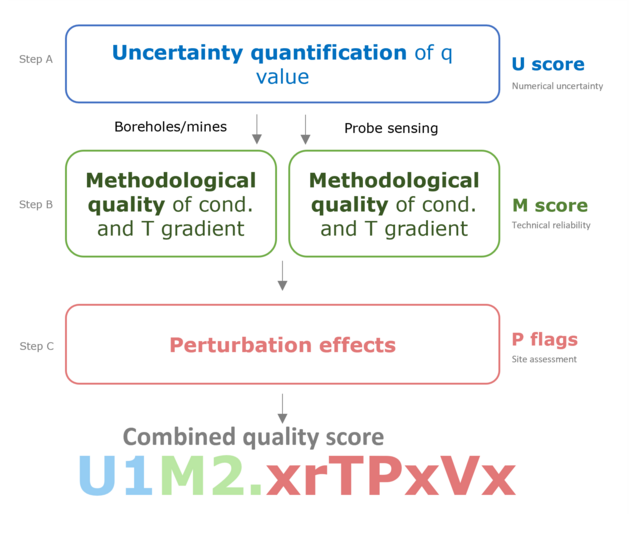
Uncertainty + Reliability + Perturbations
How the Quality Scores are used
Each heat flow measurement receives a combined quality score based on numerical uncertainty (U-Score), methodological reliability (M-Score), and environmental impact (P-Flags). These scores are automatically calculated when data is added to the database, but users can also explore our python codes for their own information. In the portal, users can filter data based on these classifications to ensure they use only the most suitable heat flow measurements for their research or applications.